I’m so glad to be receiving few Intel Optane NVMe SSDs as a sample hardware to test in my home lab, and I’m sharing in this blog the results of multiple stress tests, pushing the drives to the maximum limits possible in my lab. In the end, you make the judgement 🙂
Watch the performance test demo!
What are we going to cover today?
- What is Intel Optane storage?
- vSAN ESA vs OSA architecture
- Lab Setup
- Tests to run (SAS, NAND, Optane)
- Test Results and screen shots
- the physical configuration of my lab
- Conclusion
Let’s get started..
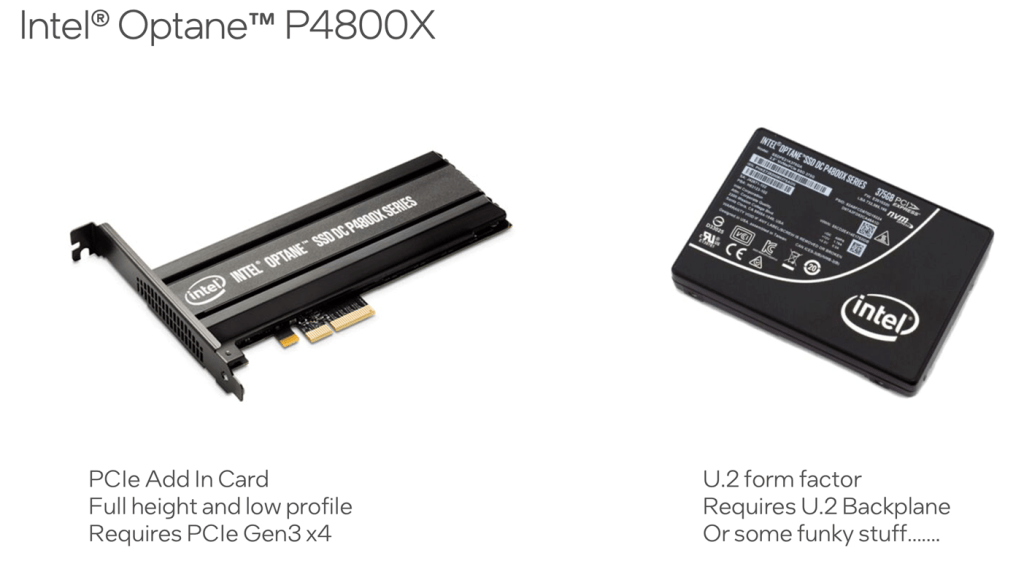
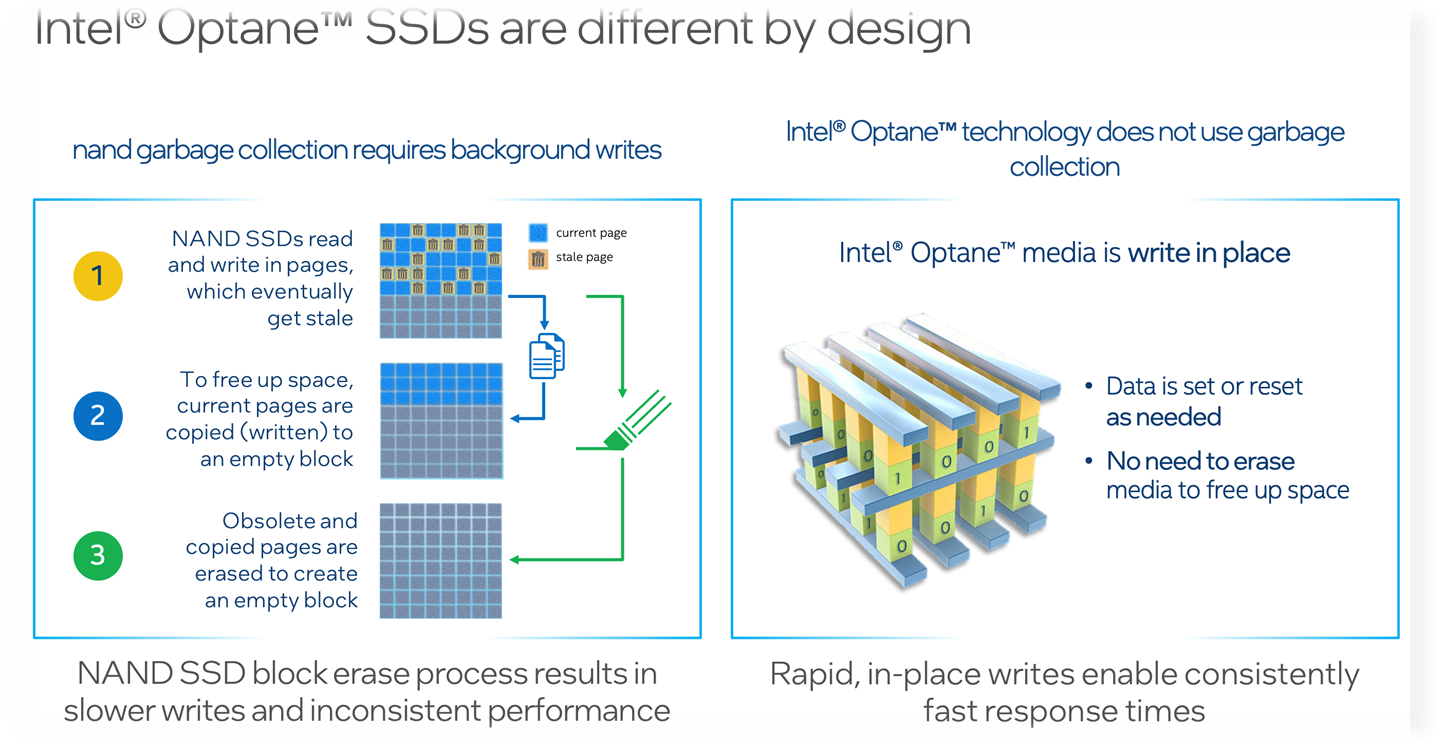
What is Intel Optane storage?
Read more about the technology here: https://www.mrvsan.com/whats-happening-with-intel-optane/
NAND vs Optane
mit’s available in different form factors, such as PCI-e and U.2

vSAN ESA vs OSA architecture
With vSAN 8.0 and the new architecture, ESA, all disks contribute to a single storage pool with a flat tier. No more disk groups or cache tiers.

Learn more here
Lab Setup
What’s in my lab?
- vSphere 8.0 + vSAN 8.0
- 3 ESXi hosts
- 2 x Intel Optane NVMw SSD PCI-e (per host)
Tests to run (SAS, NAND, Optane)
In order to emphasize the difference in performance between various storage tecdhnologies, I’m intending to run different tests as follows:
1- SAS storage tier: In this test I will use a Windows 10 machine with the storage testing utility ATTO Disk Benchmark installed on it. This VM is hosted on a standalone ESXi host, not in a vSAN cluster.
2- NAND SSD strorage tier: using the previous Win10 machine I’m running this test as that VM is configured with two virtual disks attached to it, and each is located on a different storage tier.
3- Intel Optane NVME SSD storage tier: Now, let’s run the same test with the ATTO utility, but on a different Windows 10 machine which is hosted on a vSAN 8 cluster configured with ESA and has a datastore of Intel Optane NVMEs.
4- Intel Optane NVME SSD storage tier: running another stressful performance test on the same storage tier of the previous test, but this time it’s a cluster-wide performance test leveraging VMware HCIBench stress test utility. This utility can apply tons of preasure and pushes the hardware to the maximums to see what’s the hardware capible of. Download the HCIBench here.
Test Results and screen shots
Now, it’s the real deal. I’m sharing some thoughts and screenshots for each of the mentioned tests.
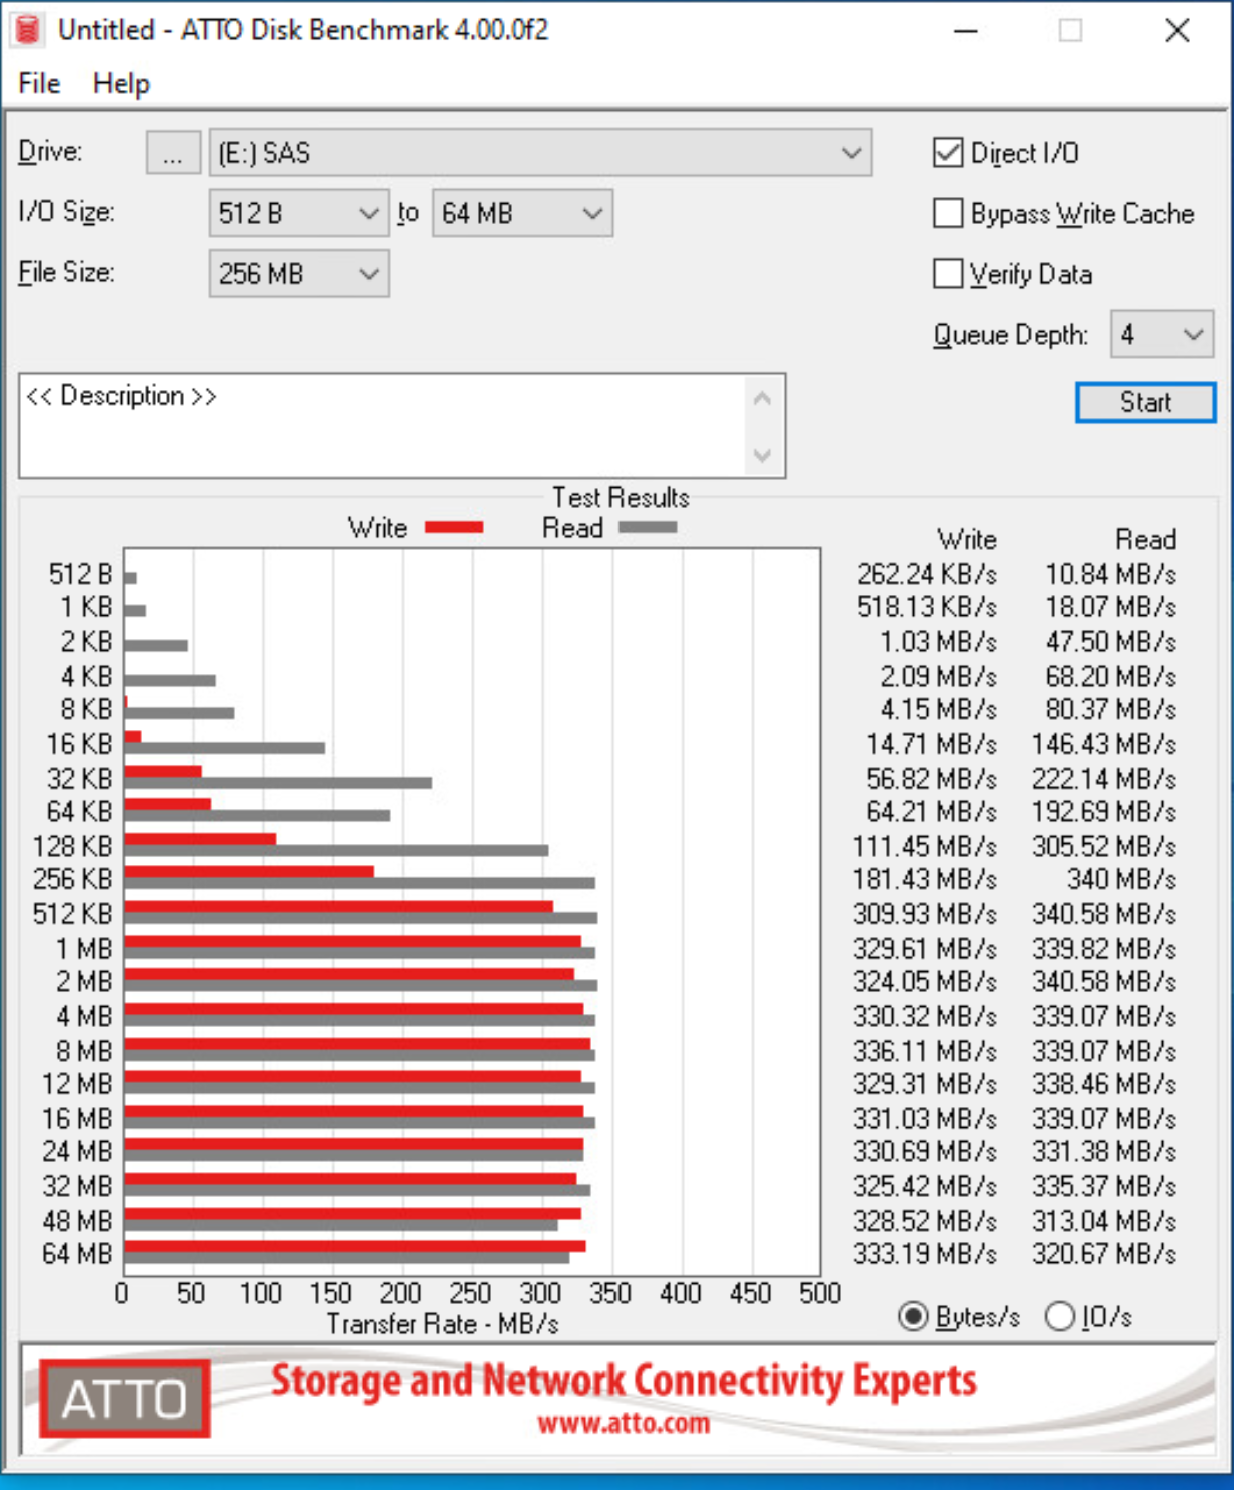
1- SAS storage tier
Platform: Windows 10 Pro
Storage tier: SAS HDD
Top speeds reached: Reads: 340MBs / Writes: 333MBs
Used utility: ATTO Disk Benchmark
Screenshot:
2- NAND SSD strorage tier
Platform: Windows 10 Pro
Storage tier: NAND SSD
Top speeds reached: Reads: 819MBs / Writes: 393MBs
Used utility: ATTO Disk Benchmark

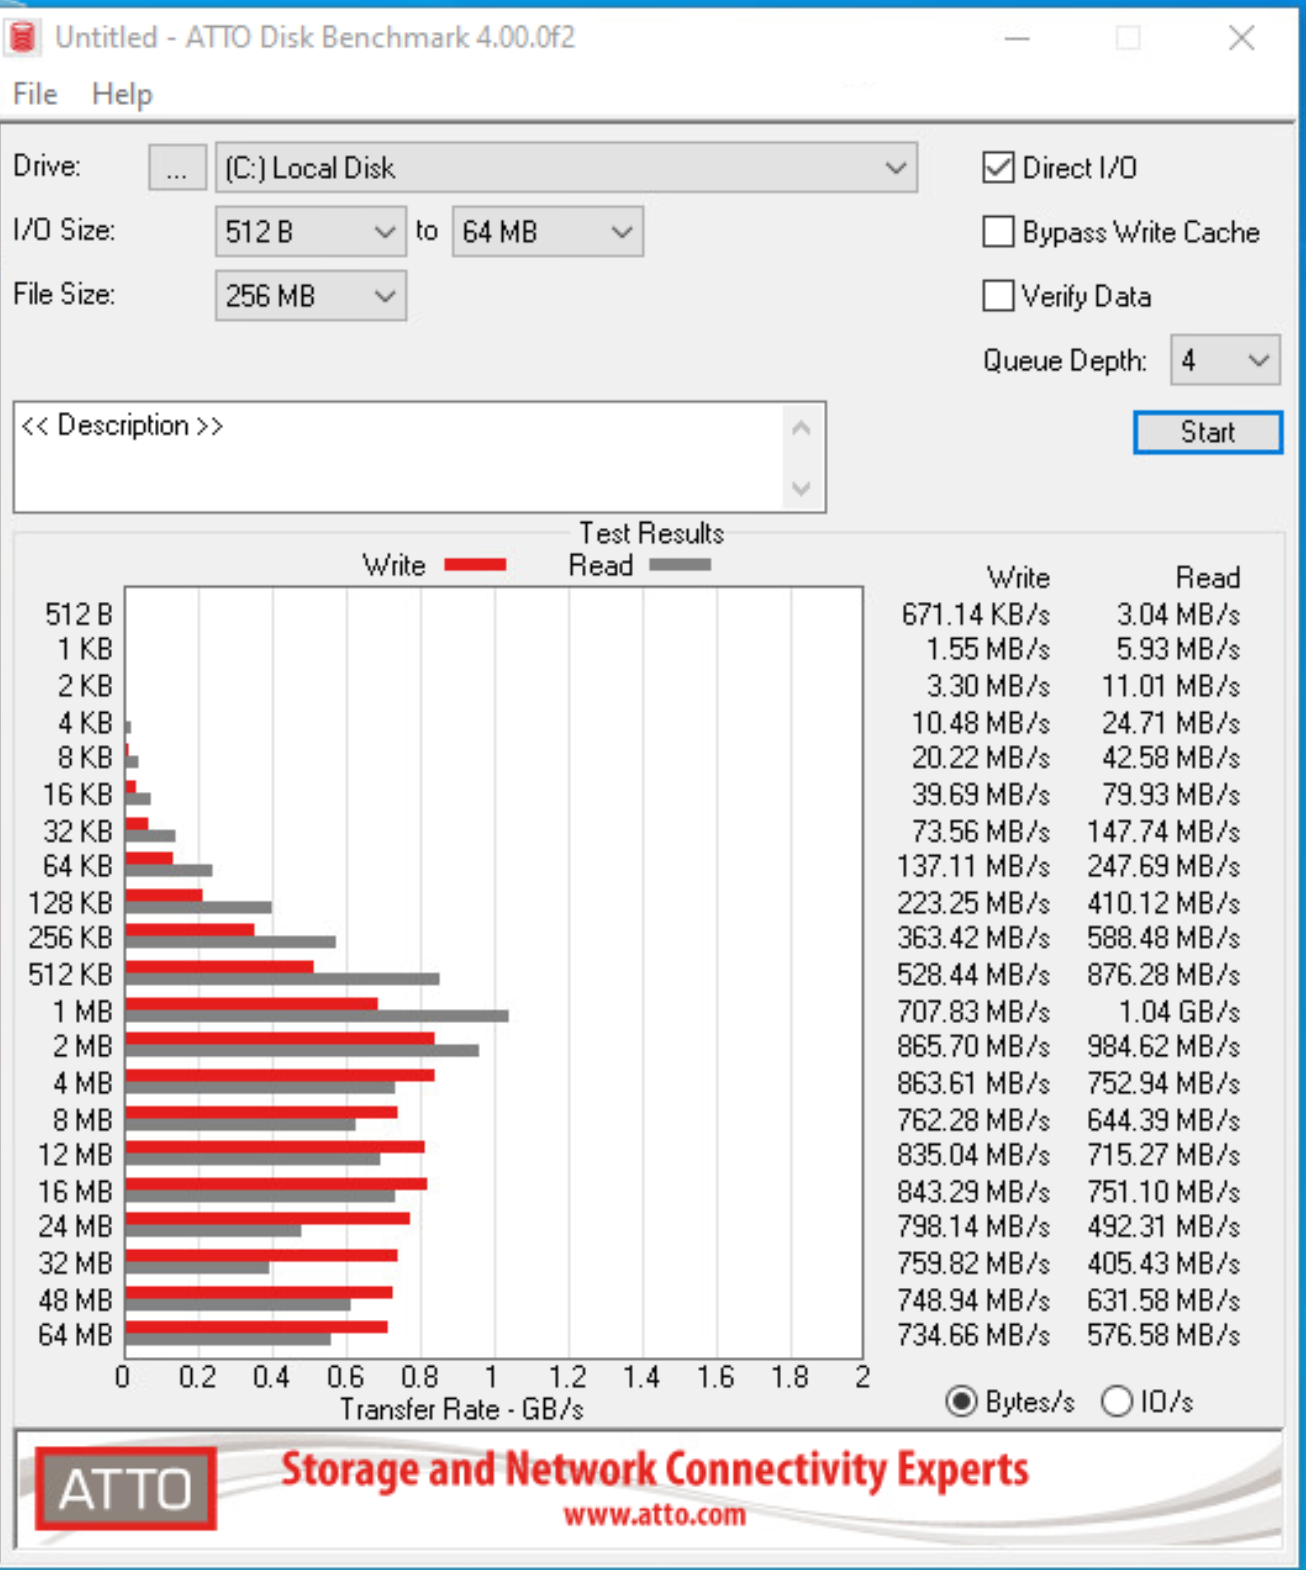
3- Intel Optane NVME SSD storage tier
Platform: Windows 10 Pro
Storage tier: Intel Optane NVMe SSD PCI-e
Top speeds reached: Reads: 1.04GBs / Writes: 865MBs
Used utility: ATTO Disk Benchmark
Snapshots
4- Intel Optane NVME SSD storage tier:
Platform: VMware vSAN8.0
vSAN architecture: ESA
Hosts count: 3
Number of sub-tests: 4
Test results:
Test name: fio_8vmdk_100ws_4k_70rdpct_100random
Datastore     = vsanDatastore
=============================
JOB_NAME	= job0
VMs		= 12
IOPS		= 30584.21 IO/S
THROUGHPUT	= 119.00 MB/s
R_LATENCY	= 7.83 ms
W_LATENCY	= 23.73 ms
95%tile_R_LAT	= 19.00 ms
95%tile_W_LAT	= 51.00 ms
=============================
Resource Usage:
+---------------------+------------+------------------+------------+
|                       Resource Utilization                       |
+---------------------+------------+------------------+------------+
| VSAN8-Cluster       | cpu.usage% | cpu.utilization% | mem.usage% |
+---------------------+------------+------------------+------------+
| esxi8-01.aitn.local | 95.16      | 95.42            | 91.57      |
| esxi8-02.aitn.local | 93.7       | 94.1             | 87.72      |
| esxi8-03.aitn.local | 92.05      | 92.59            | 86.13      |
+---------------------+------------+------------------+------------+
| Average             | 93.64      | 94.04            | 88.47      |
+---------------------+------------+------------------+------------+


cpu.usage - Provides statistics for logical CPUs. This is based on CPU Hyperthreading.
cpu.utilization - Provides statistics for physical CPUs.


vSAN Performance Stats Graph: http://10.100.10.1:3000/d/vsan_client/dom-client?orgId=1&from=1675292520000&to=1675297980000&var-datasource=fio_8vmdk_100ws_4k_70rdpct_100randompct_4threads_1675292521
PDF Report
Test name: fio_8vmdk_100ws_4k_100rdpct_100random
Datastore     = vsanDatastore
=============================
JOB_NAME	= job0
VMs		= 12
IOPS		= 56653.00 IO/S
THROUGHPUT	= 221.00 MB/s
R_LATENCY	= 6.77 ms
W_LATENCY	= 0.00 ms
95%tile_R_LAT	= 16.00 ms
95%tile_W_LAT	= 0.00 ms
=============================
Resource Usage:
+---------------------+------------+------------------+------------+
|                       Resource Utilization                       |
+---------------------+------------+------------------+------------+
| VSAN8-Cluster       | cpu.usage% | cpu.utilization% | mem.usage% |
+---------------------+------------+------------------+------------+
| esxi8-01.aitn.local | 96.11      | 96.25            | 91.52      |
| esxi8-02.aitn.local | 95.61      | 95.8             | 87.69      |
| esxi8-03.aitn.local | 96.0       | 96.17            | 86.03      |
+---------------------+------------+------------------+------------+
| Average             | 95.91      | 96.07            | 88.41      |
+---------------------+------------+------------------+------------+


cpu.usage - Provides statistics for logical CPUs. This is based on CPU Hyperthreading.
cpu.utilization - Provides statistics for physical CPUs.


vSAN Performance Stats Graph: http://10.100.10.1:3000/d/vsan_client/dom-client?orgId=1&from=1675286880000&to=1675292340000&var-datasource=fio_8vmdk_100ws_4k_100rdpct_100randompct_4threads_1675286861
Test name: fio_8vmdk_100ws_8k_50rdpct_100random
Datastore     = vsanDatastore
=============================
JOB_NAME	= job0
VMs		= 12
IOPS		= 14130.11 IO/S
THROUGHPUT	= 110.00 MB/s
R_LATENCY	= 20.11 ms
W_LATENCY	= 34.34 ms
95%tile_R_LAT	= 59.00 ms
95%tile_W_LAT	= 72.00 ms
=============================
Resource Usage:
+---------------------+------------+------------------+------------+
|                       Resource Utilization                       |
+---------------------+------------+------------------+------------+
| VSAN8-Cluster       | cpu.usage% | cpu.utilization% | mem.usage% |
+---------------------+------------+------------------+------------+
| esxi8-01.aitn.local | 75.73      | 76.9             | 92.0       |
| esxi8-02.aitn.local | 73.07      | 74.39            | 88.17      |
| esxi8-03.aitn.local | 69.33      | 70.85            | 86.41      |
+---------------------+------------+------------------+------------+
| Average             | 72.71      | 74.05            | 88.86      |
+---------------------+------------+------------------+------------+


cpu.usage - Provides statistics for logical CPUs. This is based on CPU Hyperthreading.
cpu.utilization - Provides statistics for physical CPUs.


vSAN Performance Stats Graph: http://10.100.10.1:3000/d/vsan_client/dom-client?orgId=1&from=1675298220000&to=1675303680000&var-datasource=fio_8vmdk_100ws_8k_50rdpct_100randompct_4threads_1675298194
PDF Report
Test name: fio_8vmdk_100ws_256k_0rdpct_0random
Datastore     = vsanDatastore
=============================
JOB_NAME	= job0
VMs		= 12
IOPS		= 789.47 IO/S
THROUGHPUT	= 197.00 MB/s
R_LATENCY	= 0.00 ms
W_LATENCY	= 123.32 ms
95%tile_R_LAT	= 0.00 ms
95%tile_W_LAT	= 236.00 ms
=============================
Resource Usage:
+---------------------+------------+------------------+------------+
|                       Resource Utilization                       |
+---------------------+------------+------------------+------------+
| VSAN8-Cluster       | cpu.usage% | cpu.utilization% | mem.usage% |
+---------------------+------------+------------------+------------+
| esxi8-01.aitn.local | 41.92      | 43.24            | 91.55      |
| esxi8-02.aitn.local | 40.25      | 41.64            | 87.66      |
| esxi8-03.aitn.local | 39.09      | 40.54            | 85.9       |
+---------------------+------------+------------------+------------+
| Average             | 40.42      | 41.81            | 88.37      |
+---------------------+------------+------------------+------------+


cpu.usage - Provides statistics for logical CPUs. This is based on CPU Hyperthreading.
cpu.utilization - Provides statistics for physical CPUs.


vSAN Performance Stats Graph: http://10.100.10.1:3000/d/vsan_client/dom-client?orgId=1&from=1675281240000&to=1675286700000&var-datasource=fio_8vmdk_100ws_256k_0rdpct_0randompct_1threads_1675281238
PDF Report
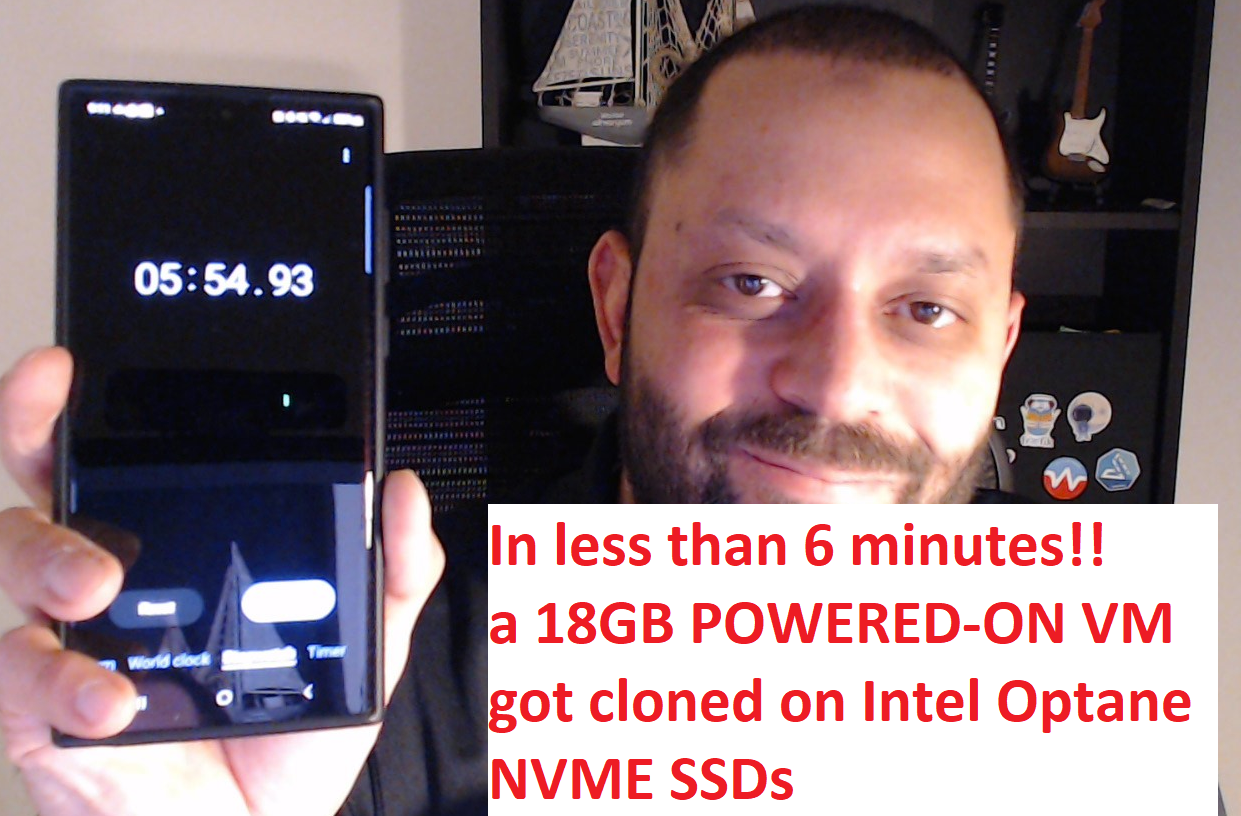
One more thing, in the demo video I’ve cloned a powered-on 18GB in size VM in less than 6 minutes 🙂
the physical configuration of my lab
You got to watch the video to learn about my physical lab setup
Conclusion
Again, it’s up to you to judge!
